Indian States vs European Economies: Tamil Nadu Vs Portugal
In our series of Indian States Vs Countries, we intend to compare Indian states with corresponding countries who have similar economies . In this article, the main criteria used for comparison is Nominal GDP. Tamil Nadu has GDP similar to Portugal but the similarity stops here.
When you step onto the bustling factory floors of Sriperumbudur near Chennai, you are standing right in the automotive and electronic manufacturing hub of South Asia. Across the ocean, in the historic cobblestone streets of Lisbon, tourism and services power a steady European economy.
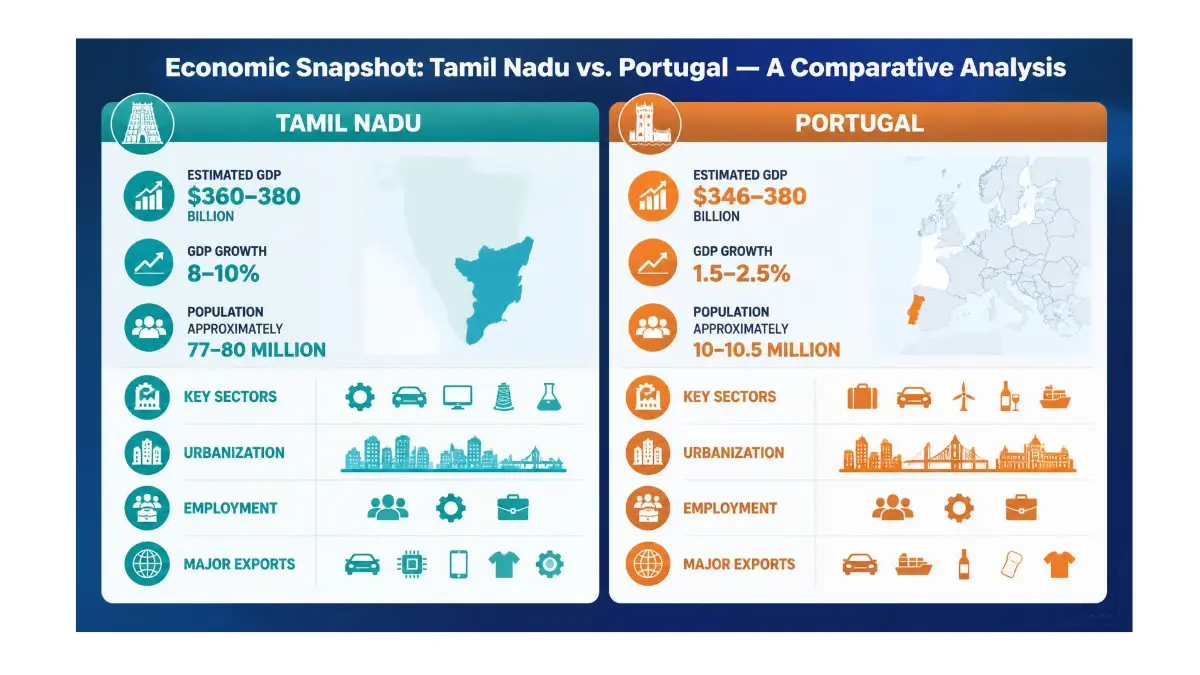
At first glance, an Indian state of nearly 78 million people and a sovereign European nation of 10.4 million might seem like an odd pairing. Yet on paper, their economic scale has converged into one of the most compelling macroeconomic showdowns of the decade.
Here is how Tamil Nadu and Portugal stack up side by side in nominal GDP output, growth trajectory, and per capita wealth.
Tamil Nadu economy comparison with Portugal
Total Output vs. Individual Wealth
The headline numbers reveal a striking paradox. In absolute terms, Tamil Nadu’s Gross State Domestic Product (GSDP) now matches or slightly exceeds the entire national GDP of Portugal. Driven by massive industrial investments, automotive manufacturing, and a dominant share in electronic exports – accounting for over 41% of India’s total electronics output – Tamil Nadu has transformed into a global supply chain hub.
However, total output tells only half the story.
Because Tamil Nadu supports a population roughly seven times larger than Portugal’s, the per capita GDP gap remains stark. Portugal’s per capita income sits around $34,000, compared to Tamil Nadu’s ~$4,800. While Tamil Nadu produces an immense volume of global goods, Portugal’s advanced, service-oriented economy delivers significantly higher individual income.
The Industrial Engine vs. The European Service Model
Why is Tamil Nadu growing at over 11% annually while Portugal grows at roughly 2%? The answer lies in their fundamental economic drivers:
- Tamil Nadu’s Growth Engine: Heavy manufacturing, EV production clusters, textile exports, and an expanding IT services footprint. A young workforce and rapid capital investment compound output exponentially year over year.
- Portugal’s Economic Engine: High-value services, renewable energy, technology hubs, and robust international tourism. As a mature European economy, growth is steady rather than explosive.
What The Future Holds
If current trajectories hold, Tamil Nadu’s total economic volume will likely double Portugal’s within the next decade. The core challenge for the southern Indian state will be translating this massive industrial volume into broad-based per capita wealth, human capital development, and higher living standards.
For global observers and data enthusiasts alike, watching a sub-national entity in Asia match the total economic footprint of an established European nation offers a vivid preview of shifting global economic power.
Data Sources Referred:
Here are the official source links for the macroeconomic data points used in the comparative table between Tamil Nadu and Portugal:
1. International & Global Macroeconomic Data (Portugal & Comparative Metrics)
- World Bank Open Data Portal
- World Bank Country Profile: Portugal
(Source for Portugal’s Nominal GDP, GDP per capita, population statistics, and annual growth metrics) - World Bank Indicators & Datasets
(Source for global trade, exports, imports, and debt metrics)
- World Bank Country Profile: Portugal
- International Monetary Fund (IMF)
- IMF World Economic Outlook (WEO) Database
(Source for official international growth forecasts, global GDP rankings, and inflation rates)
- IMF World Economic Outlook (WEO) Database
2. Indian State & National Accounts Data (Tamil Nadu)
- Ministry of Statistics and Programme Implementation (MoSPI)
- MoSPI National & State Accounts Portal
(Source for State Gross Domestic Product (GSDP) estimates, state per capita income, and national growth benchmarks) - e-Sankhyiki Official Data Portal
(Official repository for time-series state-level economic data)
- MoSPI National & State Accounts Portal
- Reserve Bank of India (RBI)
- RBI Handbook of Statistics on the Indian Economy (State-wise Statistics)
(Source for state-level financial indicators, own tax revenue, fiscal deficits, and banking throughput)
- RBI Handbook of Statistics on the Indian Economy (State-wise Statistics)
- Government of Tamil Nadu — Department of Economics and Statistics
- Department of Economics and Statistics, Tamil Nadu
(Source for official state budget releases, sector-wise growth contributions, and local economic surveys)
- Department of Economics and Statistics, Tamil Nadu


Leave a Reply