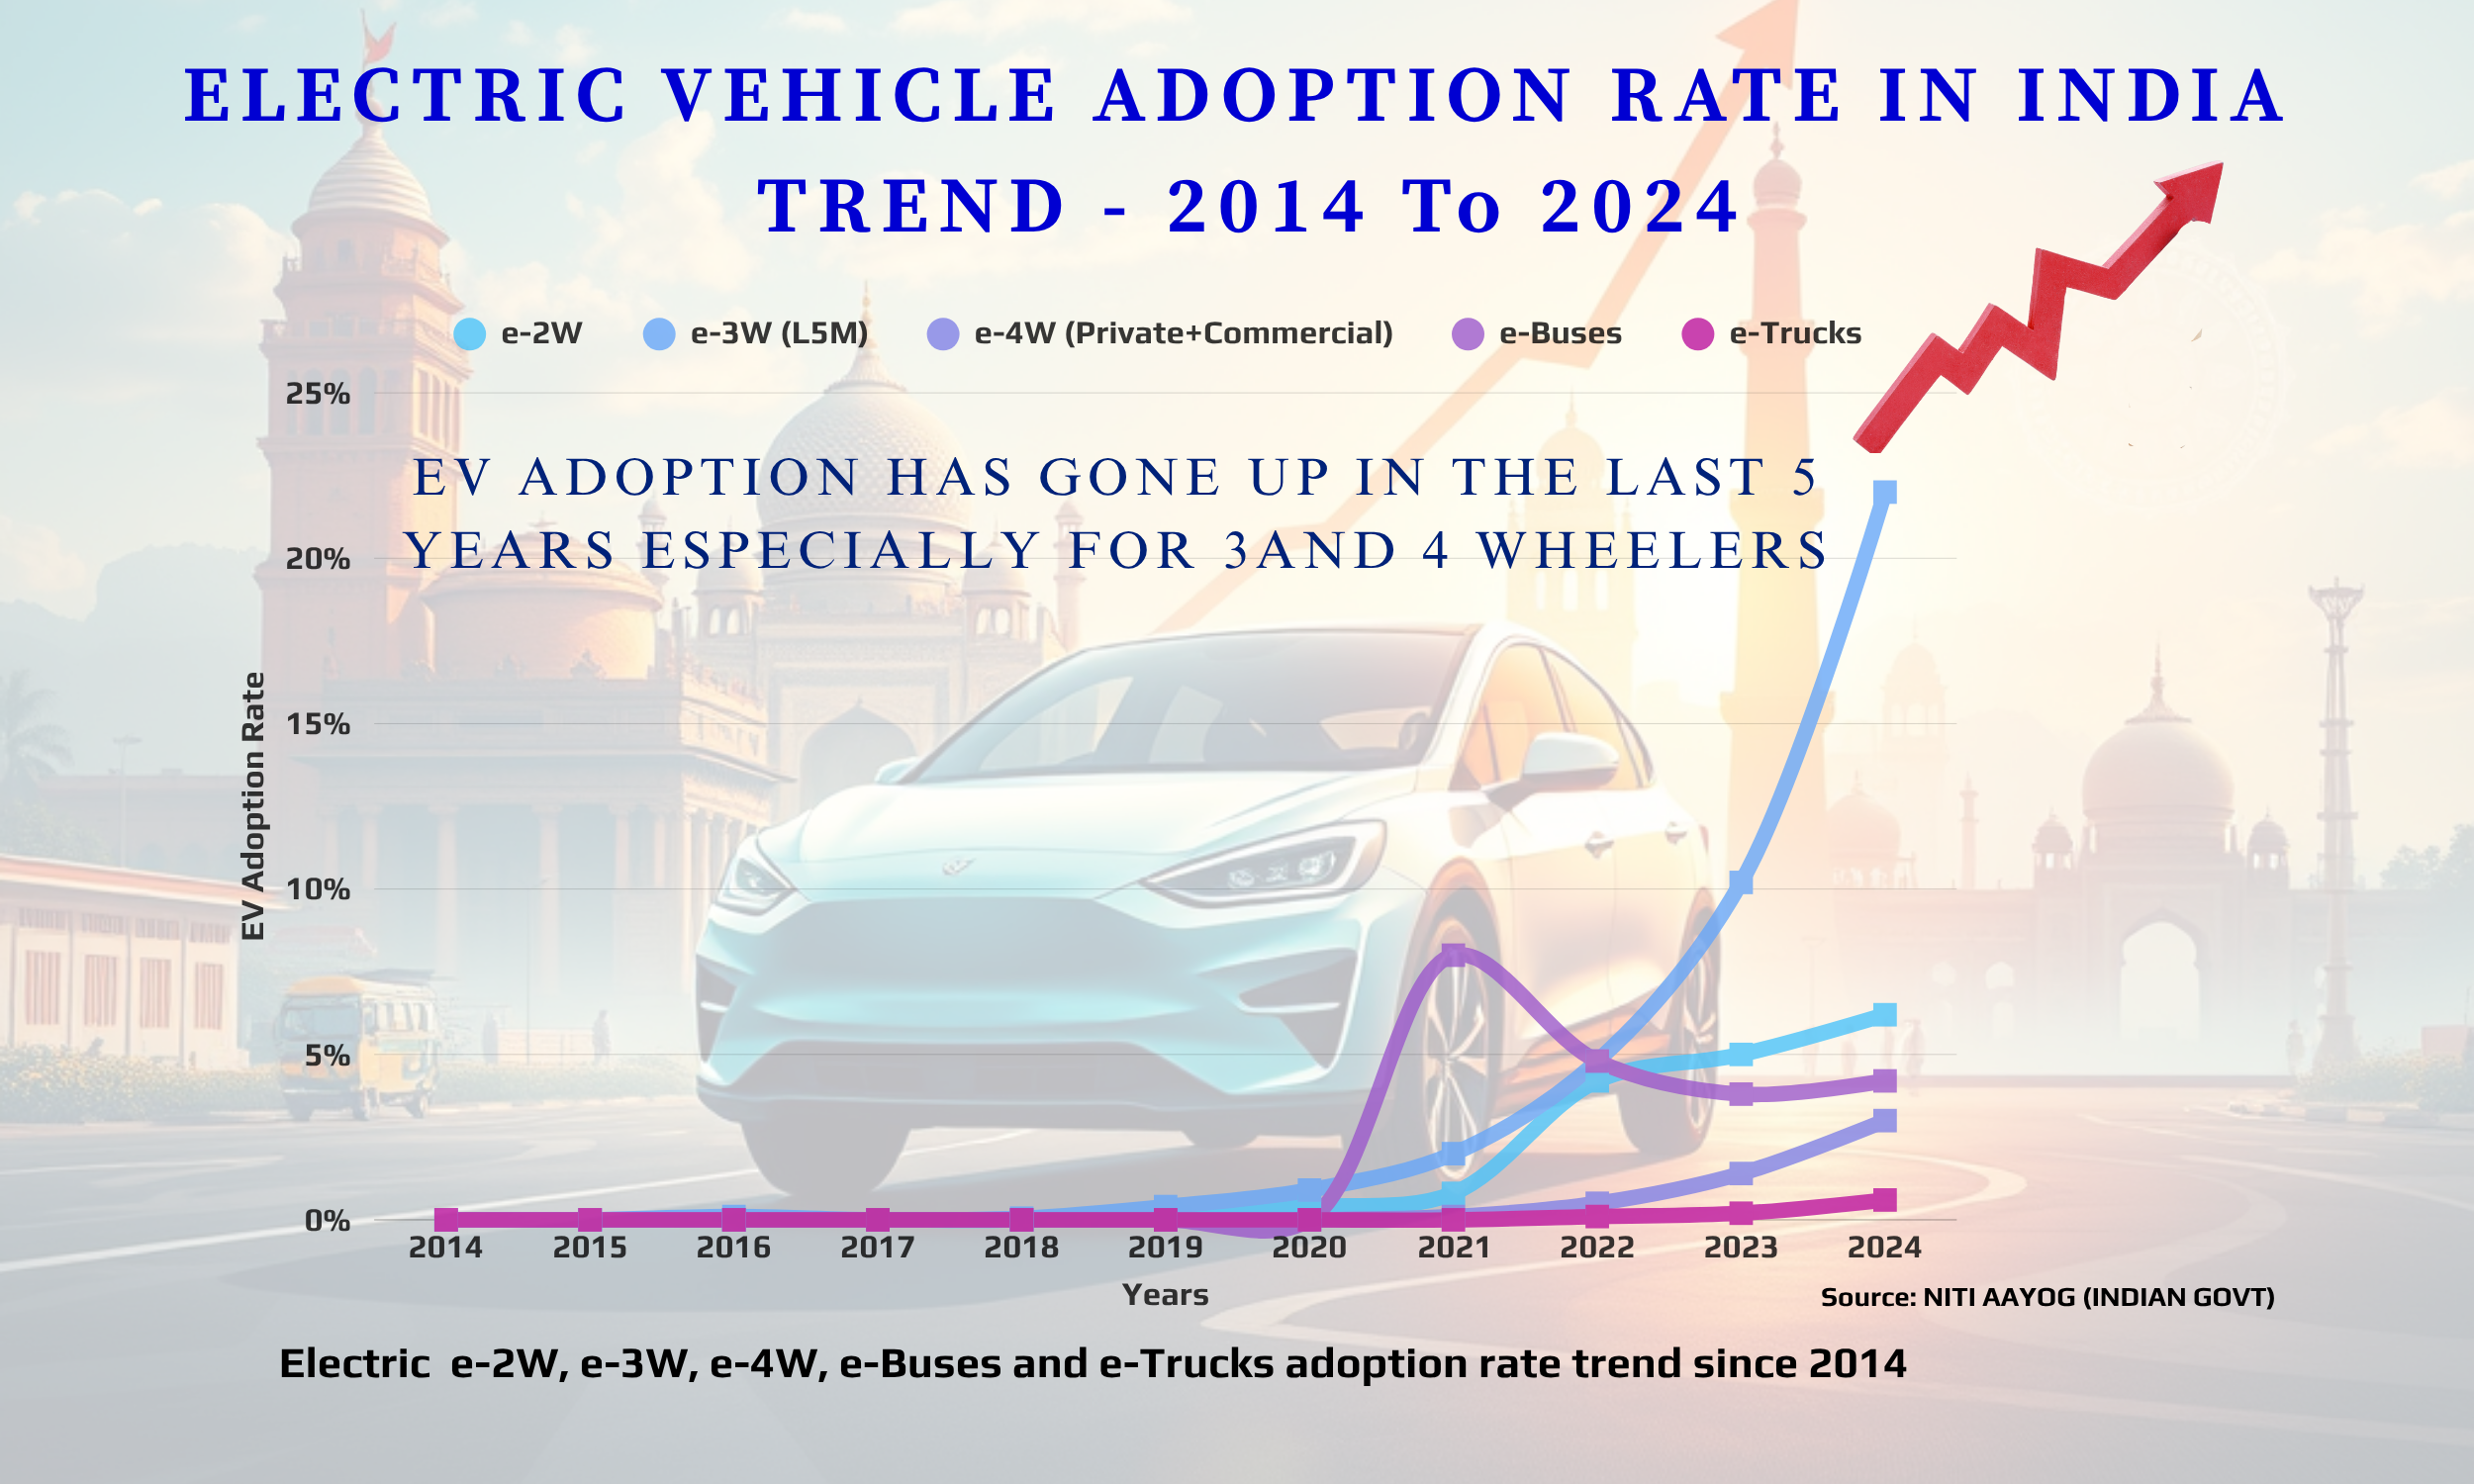
Electric Vehicle Adoption Rate In India – Trends
The electric vehicle adoption rate in India has shown a promising increase in last five years. The adoption trend in the electric three-wheeler portfolio is most promising. Data from the Niti Aayog website indicates that it now stands around 1/5th of the total count in this category
Importance of EV Adoption – Environmental & Economic Perspective
EV adoption plays an important role in decarbonizing India’s transport sector. Shifting from internal combustion engine (ICE) vehicles to electric vehicles (EVs) can significantly reduce India’s dependence on fossil fuels. It will also cut urban population.
| Other Recent Articles of Interest |
| India Electric Mobility Index 2024 |
| India Power Generation Capacity (2024) – Decade of Growth |
Electric Vehicle Adoption Rate By Electric Vehicle Type
The table below lists the adoption rate for Electric vehicles by type. As evident, apart from electric three-wheeler, two-wheeler are also increasing their percentage in their segment.
| Year | e-2W | e-3W | e-4W (Private+ Commercial) | e-Buses | e-Trucks |
| 2014 | 0.00% | 0.00% | 0.00% | 0.00% | 0.00% |
| 2015 | 0.00% | 0.00% | 0.00% | 0.00% | 0.00% |
| 2016 | 0.00% | ~0.10% | 0.00% | 0.00% | 0.00% |
| 2017 | 0.00% | 0.00% | 0.00% | 0.00% | 0.00% |
| 2018 | 0.00% | ~0.05% | 0.00% | 0.00% | 0.00% |
| 2019 | ~0.20% | ~0.40% | 0.00% | 0.00% | 0.00% |
| 2020 | ~0.40% | ~0.90% | 0.00% | 0.00% | 0.00% |
| 2021 | ~0.80% | ~2.00% | ~0.10% | ~8.00% | 0.00% |
| 2022 | ~4.20% | ~4.80% | ~0.50% | ~4.80% | ~0.10% |
| 2023 | ~5.00% | ~10.20% | ~1.40% | ~3.80% | ~0.20% |
| 2024 | ~6.20% | ~22.00% | ~3.00% | ~4.20% | ~0.60% |
India’s commitment to achieve net-zero emissions by 2070 is a crucial goal. Meeting its Paris Agreement targets of reducing emissions intensity by 45% is another significant objective. Reaching 50% electric power capacity from non-fossil sources is also being tracked as an important parameter.


Leave a Reply