
📌Key Takeaways
- Indian States By GDP Per Capita numbers are updated in the Economic Survey 2025-26.
- Sikkim is the highest state with per capita GDP income of around ₹ 5.87 Lpa
- Bihar is the state with lowest GDP per capita income of around ₹69K per annum
- Ladakh has shown the highest YOY growth of ~26%
Understanding India’s GDP Per Capita: State Insights for 2025-2026
Indian states by GDP Per Capita income are illustrated on India’s map in the above infographic. The data is taken from India’s Economic Survey 2025-26. National GDP figures often rank India among the largest and fastest-growing economies. To understand India’s economic performance deeply, a state-wise and per capita analysis is essential. We also compared the 2025 Economic Survey with previous years to identify these growth trends and chart out the YOY performances by state.
Questions like how much average income each resident generates, adjusting for population differences, are important. This is important for assessing living standards, allocating resources, and crafting targeted policy responses. At the state level, it helps in identifying which regions are successfully converting economic output into higher living standards. It also shows which regions are lagging despite overall growth.
📊 Data Integrity & Methodology
Data analysis is done on the date sourced directly from the India Economic Survey 2025-26 and the Ministry of Statistics and Programme Implementation (MoSPI). To maintain accuracy, we used the “First Advanced Estimates” for the current fiscal year and reconciled them with last year “Revised Estimates” to maintain a consistent data baseline.
The Year-over-Year (YOY) % Change was calculated using the formula:
((Current Year - Previous Year) / Previous Year) * 100.
Indian States By GDP Per Capita : 2025 – 2026
Indian States GDP Per Capita & Growth (2024-25)
| Indian State | GDP Per Capita (2024-25) | YOY % Change |
|---|---|---|
| Andhra Pradesh | ₹266,240 | 7.83% |
| Arunachal Pradesh | ₹246,813 | 8.68% |
| Assam | ₹159,185 | 6.79% |
| Bihar | ₹69,321 | 7.08% |
| Chhattisgarh | ₹162,870 | 6.31% |
| Goa* | ₹585,953 | 6.59% |
| Gujarat* | ₹300,957 | 7.64% |
| Haryana | ₹353,182 | 6.28% |
| Himachal Pradesh | ₹256,137 | 5.21% |
| Jharkhand | ₹116,663 | 5.70% |
| Karnataka | ₹380,906 | 6.70% |
| Kerala | ₹308,338 | 5.67% |
| Madhya Pradesh | ₹152,615 | 4.81% |
| Maharashtra | ₹309,340 | 6.45% |
| Manipur* | ₹119,938 | 6.95% |
| Meghalaya | ₹157,141 | 8.67% |
| Mizoram* | ₹234,996 | 9.21% |
| Nagaland* | ₹154,828 | 9.23% |
| Odisha | ₹168,966 | 6.18% |
| Punjab | ₹221,197 | 4.75% |
| Rajasthan | ₹185,053 | 6.68% |
| Sikkim* | ₹587,743 | 7.57% |
| Tamil Nadu | ₹361,619 | 10.86% |
| Telangana | ₹387,623 | 7.57% |
| Tripura | ₹192,842 | 7.75% |
| Uttar Pradesh | ₹108,572 | 7.91% |
| Uttarakhand | ₹274,064 | 5.54% |
| West Bengal | ₹163,467 | 6.28% |
| Andaman & Nicobar Islands* | ₹276,000 | 4.14% |
| Chandigarh* | ₹453,457 | 8.45% |
| Delhi | ₹493,024 | 4.31% |
| Jammu & Kashmir-UT | ₹154,826 | 6.90% |
| Ladakh-UT* | ₹242,360 | 26.07% |
| Puducherry | ₹281,478 | 5.58% |
*Data for states marked with an asterisk is based on 2023-24 estimates as per latest availability.
Important Insights From the Above Table:
The data from the Economic Survey 2025-26 includes the per capita GDP income of states. It covers the financial year 2024-25. It provides a significant shift in regional economic growth. Ladakh – UT has shown the most exceptional growth rate of 26.07% from last year. Tamil Nadu leads in growth among larger states with an impressive double-digit growth rate of 10.86% from the last fiscal year. States and UTs like Sikkim and Delhi continue to keep their lead in 2026.
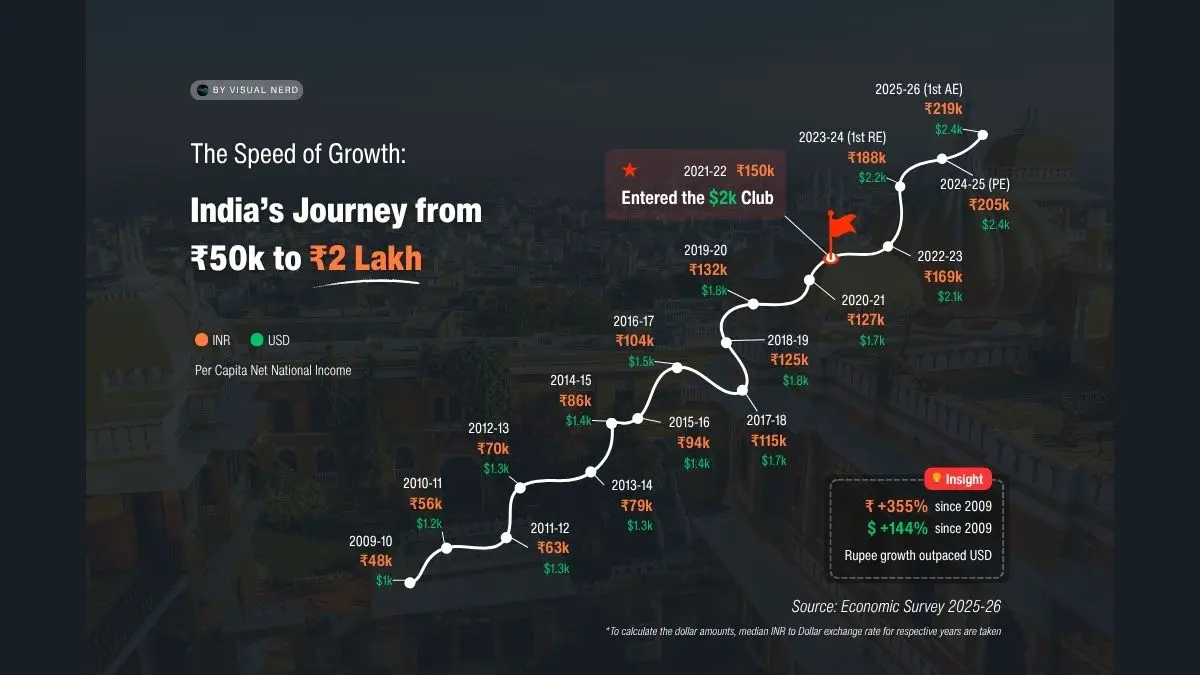
To observe how these regional disparities plays at all India level, explore our deep dive into the India Per Capita Income Journey (2009-2026) and the nation’s crossing of the ₹2 lakh milestone.
Top 10 States/UT With Highest GDP Per Capita Income (2025-2026)

✅Sikkim is a small Himalayan state that tops the list for the highest per capita income. It documents the per capita income of ₹ 5.87 lakh per annum in the latest economic survey. Hydro power projects, tourism, and a small population allow income to stretch further for each resident.
✅Goa is in second position. Tourism and services help to achieve a per capita income of ₹ 5.85 lpa.
✅Delhi is in third place, where tourism, trade, finance, and dense service push the per capita figure to ₹ 4.93 lpa.
✅Chandigarh is in fourth place in this list with a per capita income of ₹ 4.53 lpa. It’s a union territory. It is also the capital of Haryana and Punjab. This provides a solid base for high per capita income.
✅Telangana, powered by IT services, pharmaceuticals, and rapid urban growth, records a strong rupee ₹ 3.87 lpa per capita income.
✅Karnataka is the next state in sixth position with ₹ 3.80 lpa per capita income, and it leverages Bengaluru’s technology sector and export-oriented services.
✅Tamil Nadu (₹ 3.61 lpa per capita income) sustains its position through diversified manufacturing, automobile exports, and a broad industrial base.
✅Haryana is the next in the list with ₹ 3.53 lpa per capita income. It gains from its proximity to Delhi, industrial clusters, and high workforce participation.
✅Maharashtra is the largest state by GDP. However, it ranks ninth on a per capita basis. This is because its large population spreads income gains more thinly.
✅Kerala closes the list of top 10 states/UT with a per capita income of ₹ 3.08 lpa
Lowest Indian States By GDP Per Capita (2025-2026)
At the lower end, states like Uttar Pradesh (₹ 93,514) and Bihar (₹ 60,337) illustrate population pressure and lower industrialization. They also show high dependence on agricultural activity constraints the per capita outcomes. Even where total output grows, limited job creation in high-value sectors keeps average incomes low.
Also READ
Conclusion
Looking ahead, understanding state-wise per capita income is crucial for shaping India’s inclusive growth. By addressing regional disparities through targeted investments, the country can guarantee higher living standards. Skill development and balanced industrialization will aid in achieving fair prosperity among all states through future economic expansion.


Leave a Reply